 Open Seizure Detector
Free, Open Source tools to Alert Carers if someone suffers an Epileptic Seizure
Original OSD Algorithm
The Original OSD algorithm looks for seizure-like rhythmic motion in accelerometer data. It uses a frequency analysis approach and has been part of OpenSeizureDetector since the early versions.
How it works
At a high level:
- Collect a time window of acceleration samples.
- Convert the signal into the frequency domain (FFT).
- Measure power in a seizure-focused frequency band.
- Compare that power and its ratio against thresholds.
- Report an algorithm alarm when both threshold checks pass.
flowchart LR
    A[Acceleration samples] --> B[FFT]
    B --> C[ROI power between AlarmFreqMin and AlarmFreqMax]
    B --> D[Total spectral power up to cutoff]
    C --> E[Check 1: ROI power > AlarmThresh]
    C --> F[Check 2: 10 x ROI power / spectrum power > AlarmRatioThresh]
    D --> F
    E --> G{Both checks true?}
    F --> G
    G -->|Yes| H[OSD algorithm alarm]
    G -->|No| I[OSD algorithm OK]
User settings
These are the key settings you can tune in current Android app versions:
| Setting | What it changes |
|---|---|
| OsdAlarmActive | Enables or disables the Original OSD algorithm. |
| AlarmFreqMin | Lower edge of the target frequency band. Lower values make it more sensitive to slower rhythmic movement. |
| AlarmFreqMax | Upper edge of the target frequency band. Higher values include faster rhythmic movement. |
| AlarmThresh | Minimum movement power needed before OSD can trigger. Increasing it usually reduces sensitivity and false alarms. |
| AlarmRatioThresh | How concentrated movement must be in the target band. Higher values require a cleaner seizure-like frequency signature. |
Practical tuning effect
flowchart TD
    A[Increase AlarmThresh] --> B[Harder to trigger]
    C[Decrease AlarmThresh] --> D[Easier to trigger]
    E[Increase AlarmRatioThresh] --> F[Needs clearer rhythmic pattern]
    G[Widen AlarmFreqMin or AlarmFreqMax range] --> H[Detects broader movement patterns]
Typical when to adjust
- Too many alarms during repetitive daily movements: increase AlarmThresh or AlarmRatioThresh slightly.
- Missed events with slower rhythmic movement: lower AlarmFreqMin slightly.
- Missed events with faster rhythmic movement: raise AlarmFreqMax slightly.
For context and history of the frequency method, see the project notes at: https://www.openseizuredetector.org.uk/?page_id=455
Technical details
This section provides the detailed technical description of the OSD algorithm and design rationale.
Algorithm sequence
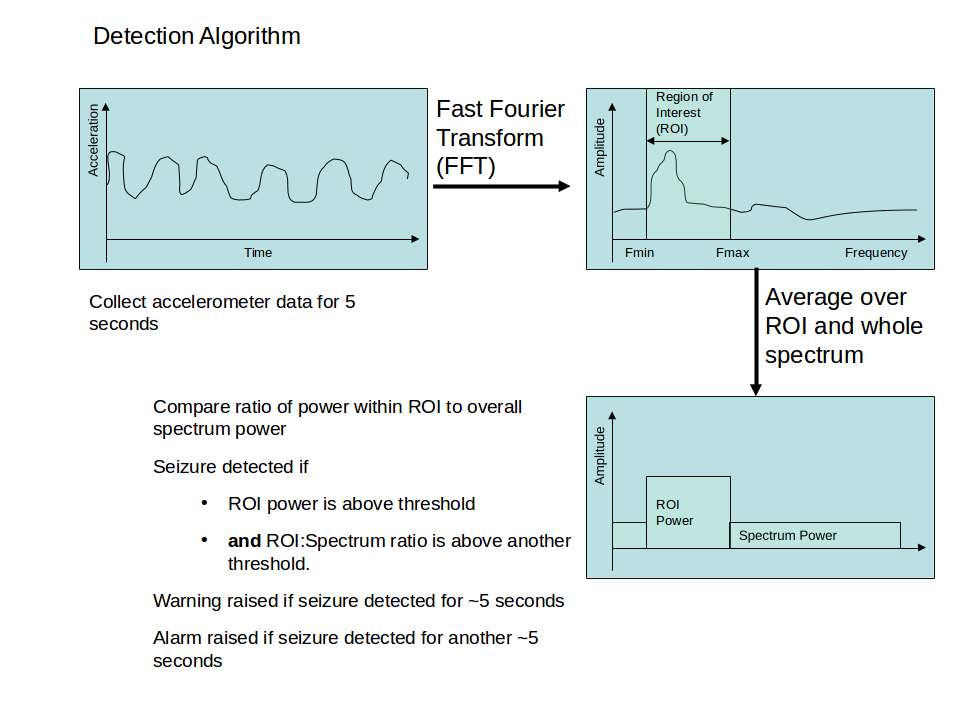
The original OSD acceleration algorithm is described as:
- Collect accelerometer data at 25 Hz for 5 seconds.
- Run an FFT to convert the acceleration signal into frequency-domain bins.
- Calculate average power in the Region Of Interest (ROI), typically 3-8 Hz.
- Calculate average power in the overall spectrum (up to configured cutoff).
- Calculate the ratio of ROI power to spectrum power.
- Mark seizure-like movement when both checks pass:
- ROI power above threshold
- ROI/spectrum ratio above threshold
- Raise warning/alarm states when seizure-like movement persists over consecutive analysis windows.
Region Of Interest (ROI) diagram
Detection diagram:
Conceptually, the ROI check is:
flowchart LR
    A[FFT spectrum 0 to Nyquist] --> B[ROI band AlarmFreqMin to AlarmFreqMax]
    A --> C[Reference spectrum power]
    B --> D[ROI power]
    C --> E[Spectrum power]
    D --> F[Power threshold check]
    D --> G[Ratio check with spectrum power]
    E --> G
Why 25 Hz sampling was chosen
The sampling rationale compares watch sampling choices 10, 25, and 100 Hz.
- 10 Hz gives Nyquist 5 Hz, which is marginal for seizure movement expected around 5-10 Hz.
- 25 Hz gives Nyquist 12.5 Hz, covering the target movement band with moderate compute cost.
- 100 Hz gives Nyquist 50 Hz, but significantly increases data volume and processing cost.
With a 5 second analysis window:
- Frequency resolution is Delta f = 1/T = 1/5 = 0.2 Hz.
- Maximum detectable frequency is f_max = f_s/2 = 25/2 = 12.5 Hz.
This is why the design summary selected 25 Hz sampling with 5 second windows.
Additional notes
- The algorithm documentation also describes an experimental multiple-ROI variant to improve detection of lower-frequency seizure movement (for example around 4 Hz).
- The documentation also notes expected FFT behavior, including strong low-frequency/DC components caused by gravity in accelerometer signals.
What the design is trying to detect
The design targets sustained rhythmic movement typical of tonic-clonic seizure phases, with energy often concentrated in approximately the 5-10 Hz region.
Important assumptions:
- Motion axis is not known in advance, so acceleration channels are combined into a single motion signal for analysis.
- Detection is based on rhythmic structure over several seconds, not a single instantaneous spike.
- A secondary low-frequency objective (for example breathing-related motion) was discussed but not part of the standard seizure detector path.
Sampling system and FFT trade-offs
The practical trade-off is between sampling frequency, maximum detectable frequency, and compute/data load.
| Sampling frequency | Nyquist (f_s/2) | Interpretation |
|---|---|---|
| 10 Hz | 5 Hz | Considered borderline/too low for seizure motion around 5-10 Hz |
| 25 Hz | 12.5 Hz | Chosen compromise: covers target band with manageable processing |
| 100 Hz | 50 Hz | Plenty of bandwidth, but much higher data and compute load |
For a 5 second analysis window:
- Samples per window at 25 Hz: N = 25 x 5 = 125.
- Frequency resolution: Delta f = 1/T = 0.2 Hz.
This means the detector updates in discrete analysis windows (every 5 seconds), each with 0.2 Hz spectral bin spacing.
Warning and alarm timing interpretation
Timing can be interpreted as:
- One analysis decision per 5 second window.
- Warning after persistent seizure-like windows over about 10 seconds.
- Alarm after additional persistent seizure-like windows.
In current app architecture, final app-level WARNING/ALARM timing is additionally controlled by Algorithm Voting timing settings (WarnTime and AlarmTime), so effective user-visible timing depends on both algorithm output persistence and global state-machine settings.
flowchart LR
    A[5 s analysis window] --> B[OSD alarm/no alarm result]
    B --> C[Consecutive positive windows accumulate]
    C --> D[Global warning and alarm timers]
    D --> E[User-visible OK/WARNING/ALARM state]
Expected FFT behavior
Expected FFT-derived behavior:
| Observation | Why it happens | Practical implication |
|---|---|---|
| Strong DC or very low-frequency component | Accelerometer includes gravity offset | Low-frequency bins can dominate unless normalized/ratio-based checks are used |
| ROI band rises during rhythmic shaking | Seizure-like rhythmic motion concentrates energy in ROI | ROI power threshold is a primary detector gate |
| Ratio check improves specificity | Compares ROI concentration to broader spectrum | Helps reject broad-spectrum movement that is not seizure-like |
Alternative multiple-ROI concept
The documentation also describes an alternative detector variant using more than one Region Of Interest (for example standard 3-8 Hz plus an additional lower-frequency band) to improve sensitivity for some partial or lower-frequency patterns.
This is presented as an experimental extension rather than the baseline default path.
flowchart TD
    A[FFT spectrum] --> B[ROI 1: standard seizure band]
    A --> C[ROI 2: lower-frequency auxiliary band]
    B --> D[Compute band powers and ratios]
    C --> D
    D --> E[Combine criteria for detection decision]
Historical context
The algorithm write-up was created in 2015 and updated in 2024 to better match Garmin/PineTime implementation while retaining the original sampling and FFT rationale.